Data from MOWLAS, together with advanced computer simulations, feeds into research conducive to better assessing the possibility of future large earthquakes. Knowledge and findings are combined into catalogs, which improves modeling and understanding of seismic activity and provides enhanced capabilities for assessments.

Points show the hypocenters of earthquakes with magnitudes of 2.5 or greater in 2015. Color gradually changes from red to blue with depth. Plates subducting beneath the Japan islands are illuminated by the seismicity.
This animation shows numerical modeling of slow slip events (SSEs) along the Nankai Trough. SSE occurs in the white-colored area.

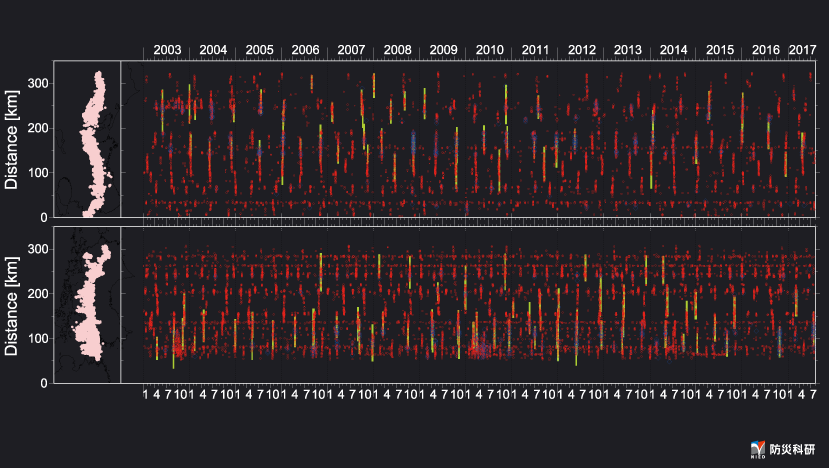
Red circles, blue diamonds, and green thick bars indicate low frequency tremor, very low frequency earthquakes, and short-term slow slip events, respectively. Many slow earthquakes occur along the Nankai Trough.